42 Useful Charts and Infographics that Make Data Beautiful
Nathan Johnson
Published
02/11/2023
in
wow
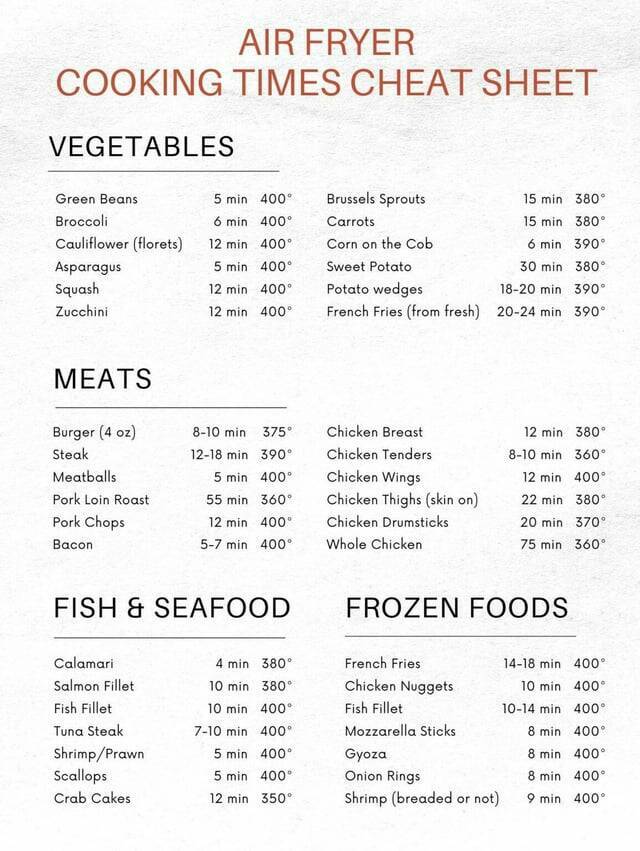
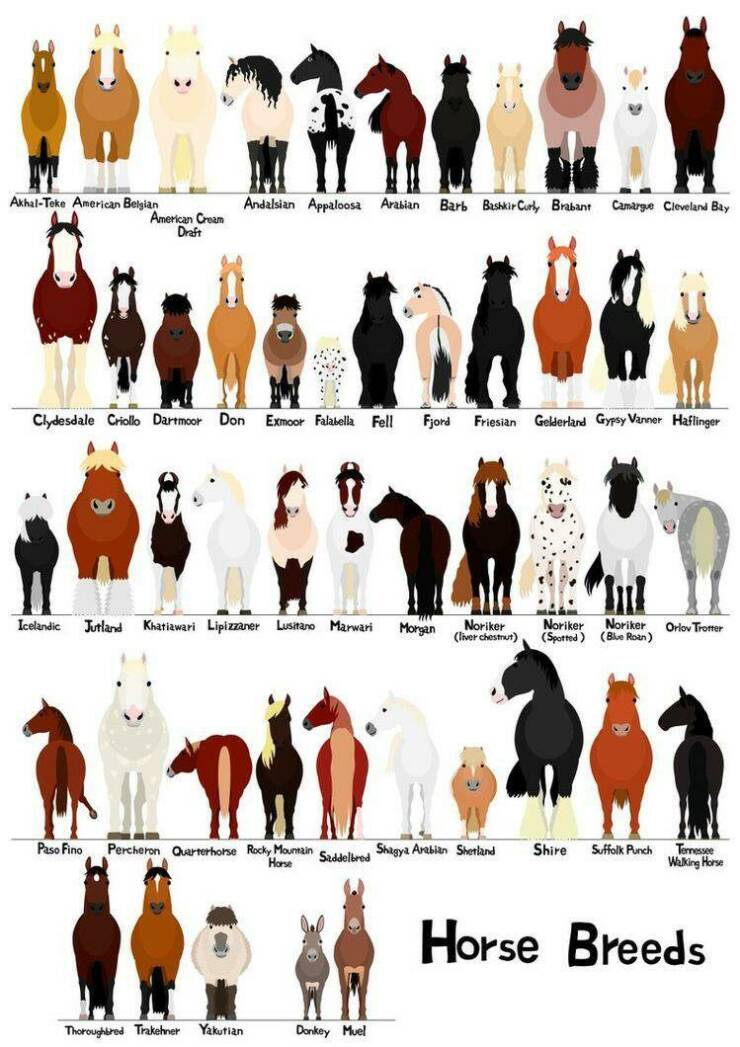
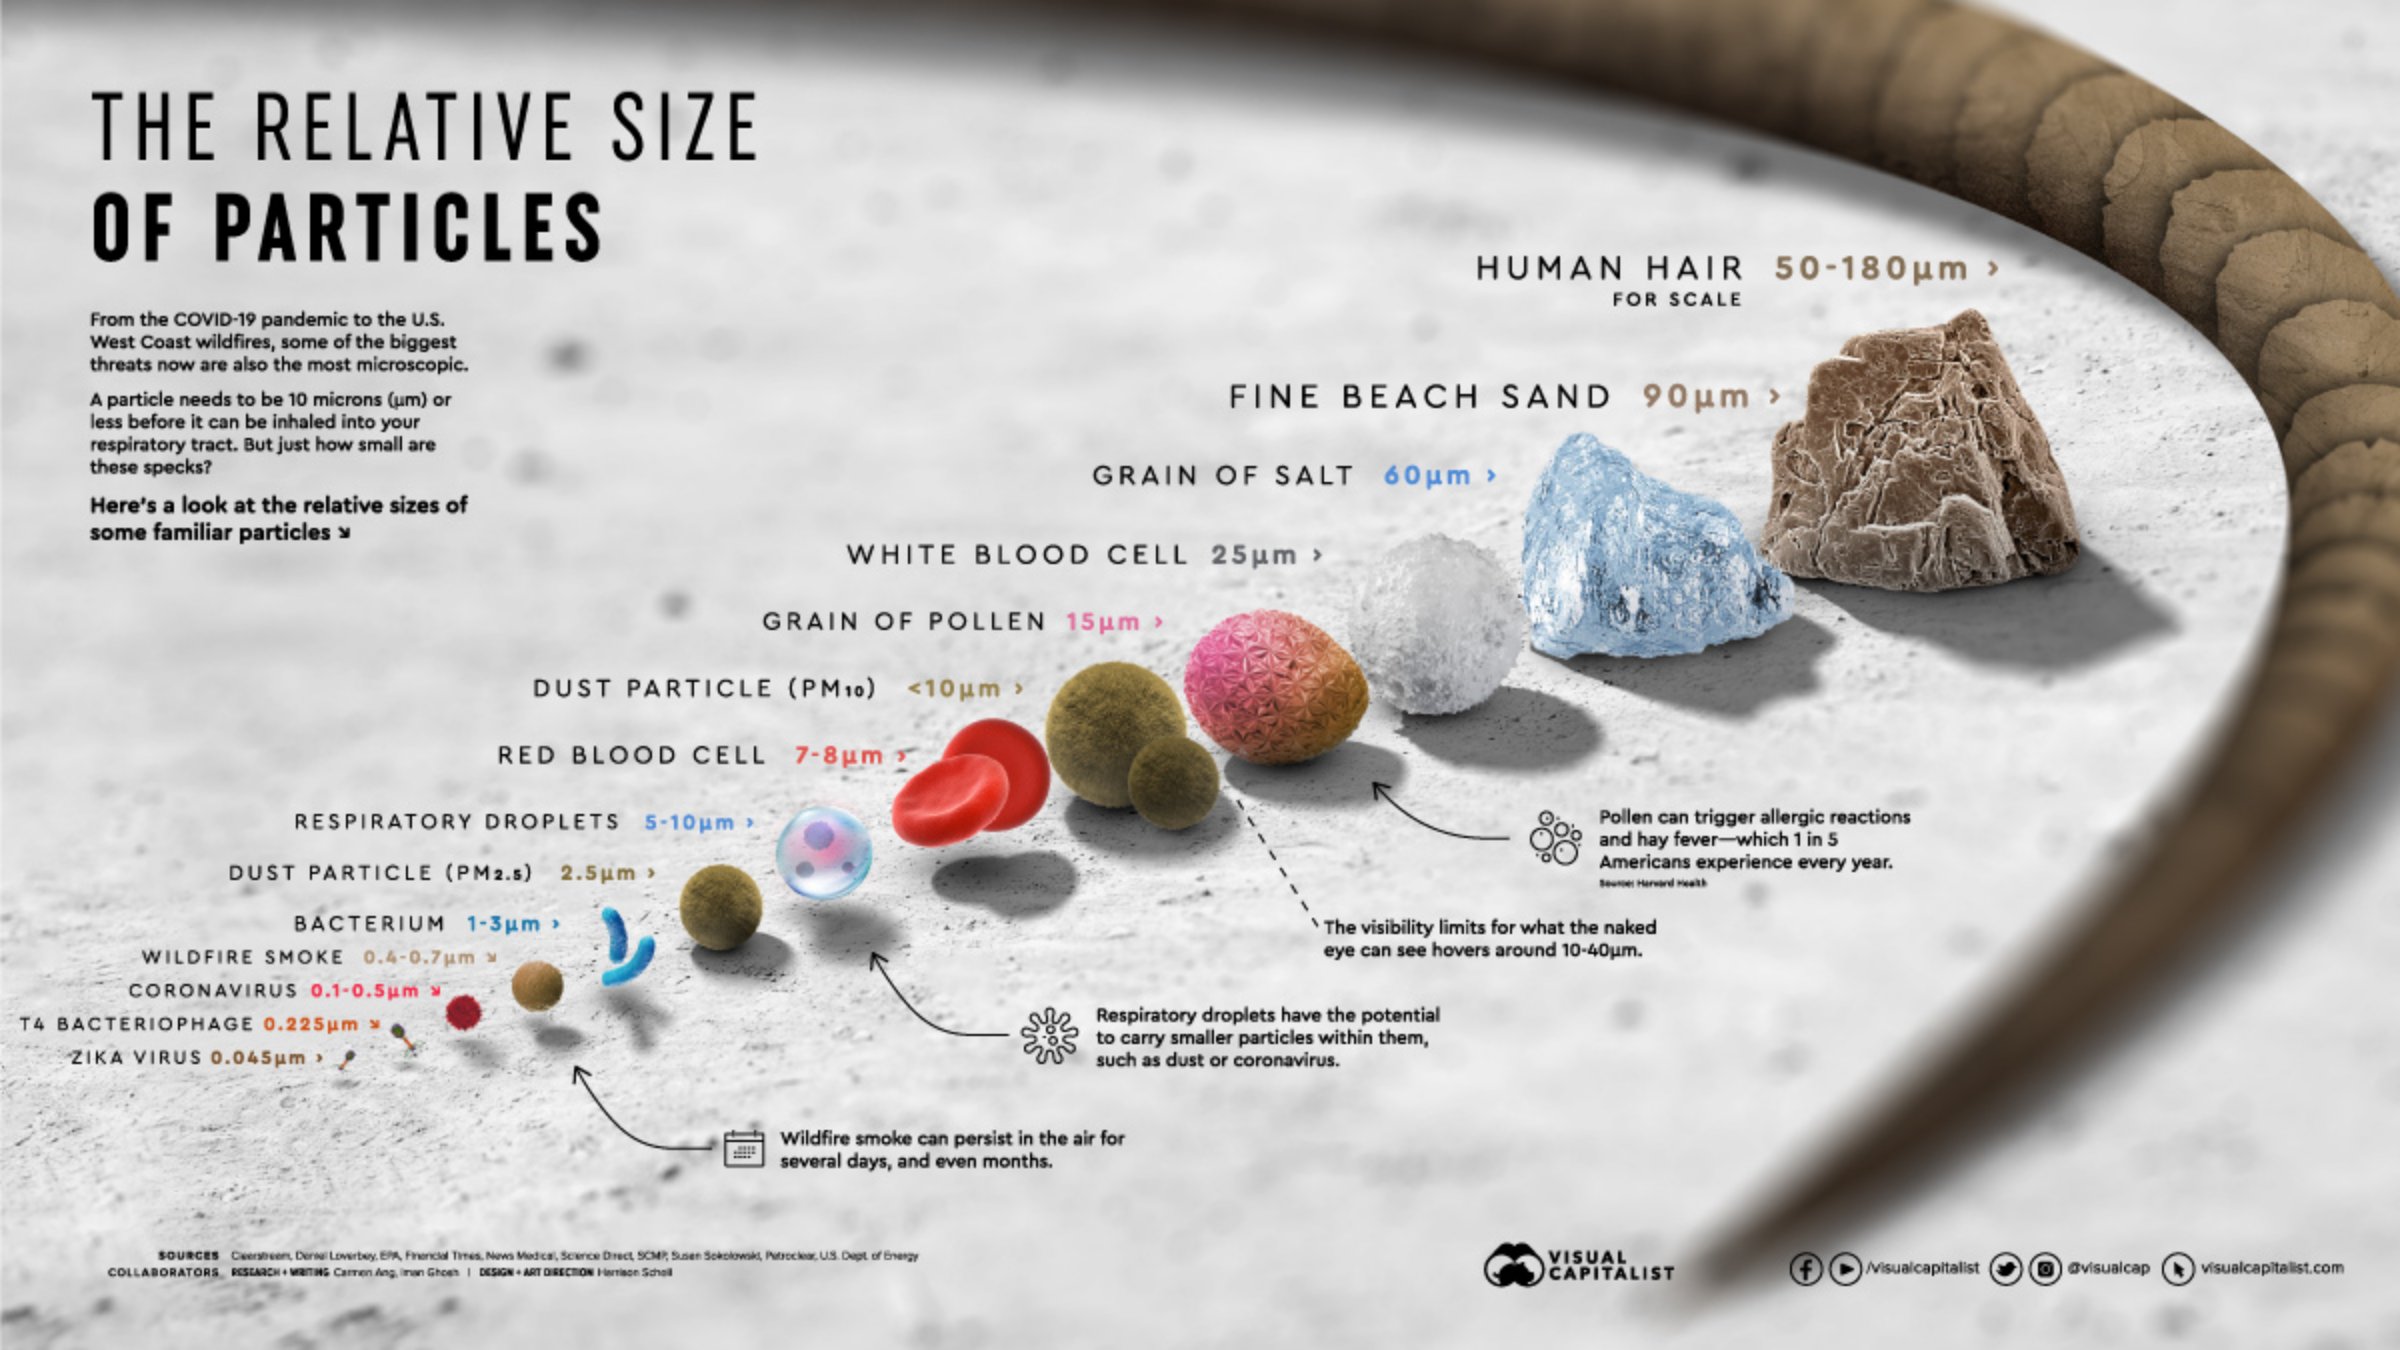
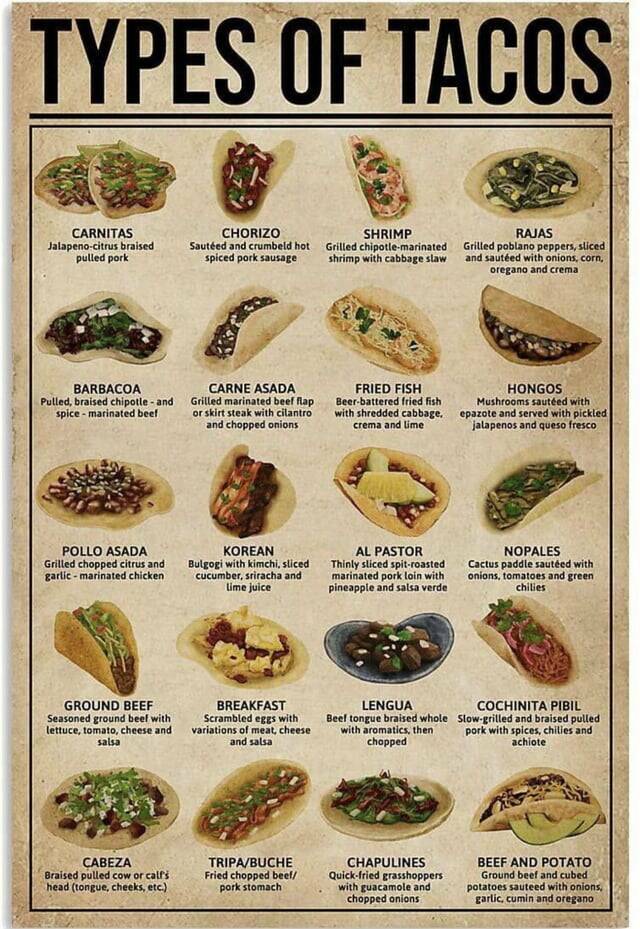
The world we live in has all kinds of fascinating facts, intriguing information, and endless data. It can be a lot to take in when just staring at numbers and information. Thankfully we have charts, graphs, and infographics to help us digest and make sense of it all. Check out these 42 interesting data sets that prove there is a chart for almost anything.
- List View
- Player View
- Grid View
Advertisement
-
1.
-
2.
-
3.
-
4.
-
5.
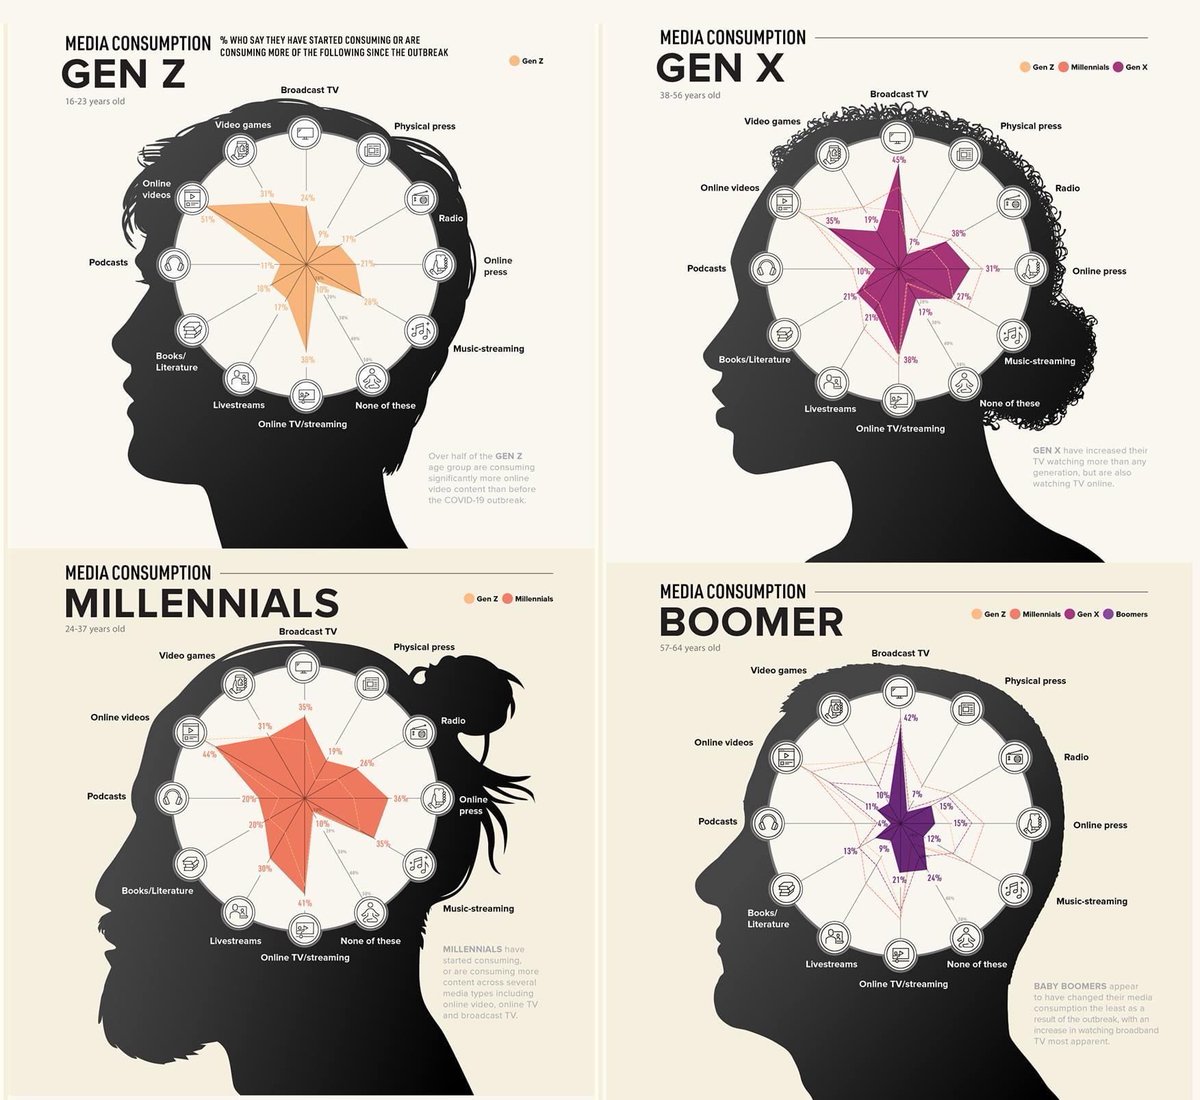 The difference in media consumption, 4 generations
 -
6.
-
7.
-
8.
-
9.
-
10.
-
11.

-
12.
-
13.
-
14.
-
15.
-
16.
-
17.
-
18.
-
19.
-
20.
-
21.
-
22.
-
23.
-
24.

-
25.
-
26.

-
27.
-
28.
-
29.
-
30.
-
31.
-
32.
-
33.
-
34.

-
35.
-
36.

-
37.
-
38.
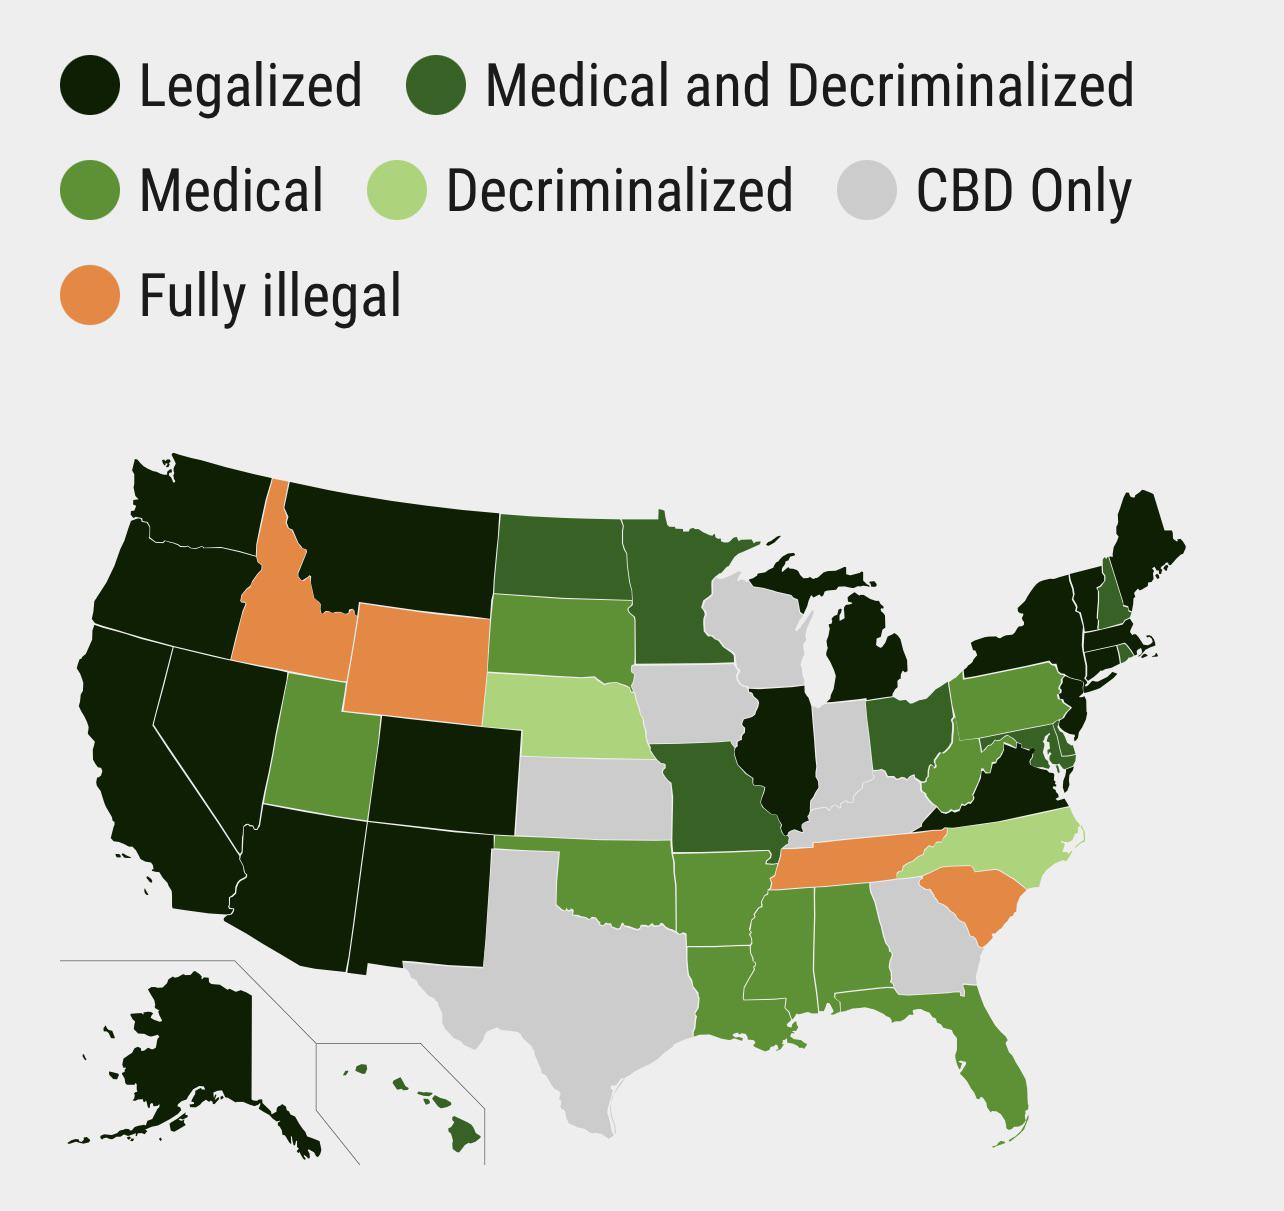 The current state of legalization in the US
 -
39.

-
40.

-
41.
-
42.
 The 7 Steps To Forgiving Yourself
 -
43.
-
44.

-
45.

- REPLAY GALLERY
-
- 42 Useful Charts and Infographics that Make Data Beautiful
- NEXT GALLERY
-

- 15 WTF Weed Strains From Crazy to Offensive
45/45
1/45


10 Comments