21 Beautiful Infographs of Interesting Data
Nathan Johnson
Published
01/14/2021
in
wow
You might learn something here.
- List View
- Player View
- Grid View
Advertisement
-
1.
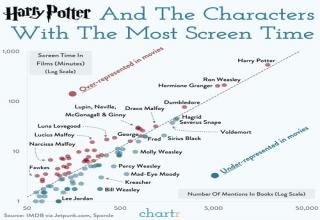
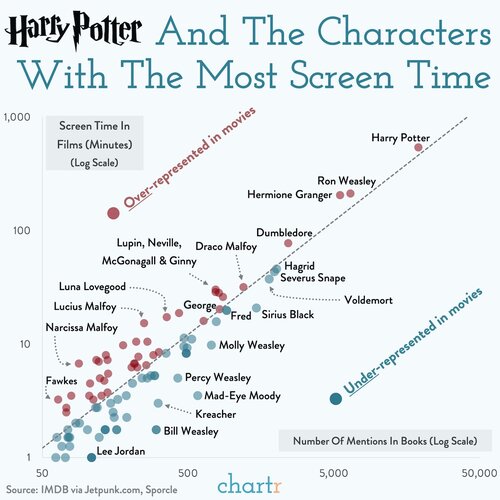 Harry Potter Characters: Screen time vs. Mentions In The Books
 -
2.
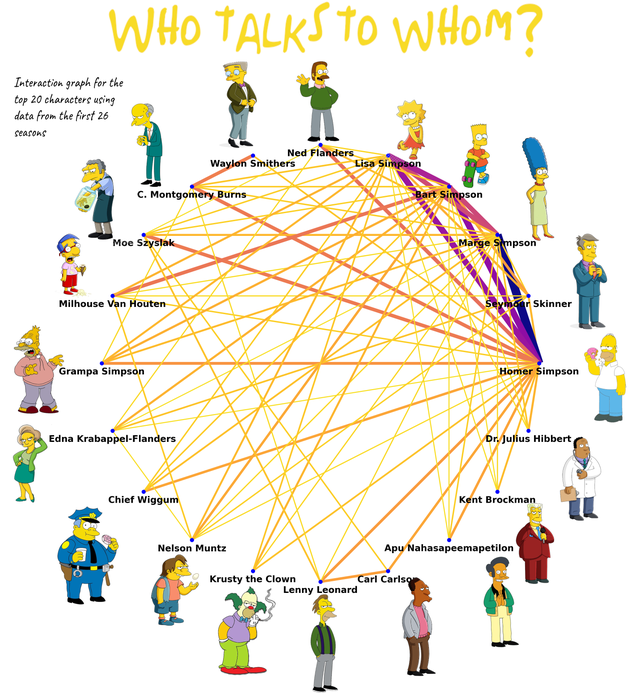 Interaction Intensity in the Simpsons
 -
3.
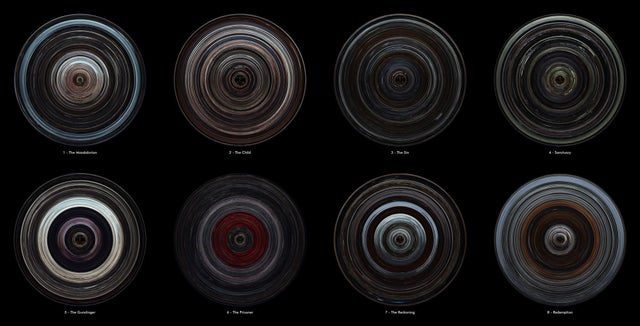 The Mandalorian Season 1 episodes displayed as disks, the first frame is the border of the disk, the ending credits at the center.
 -
4.
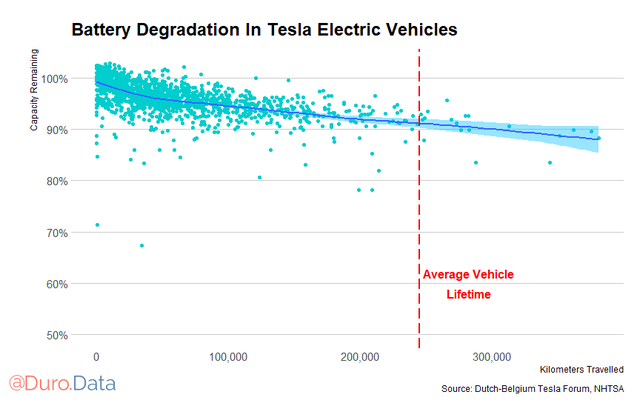 Tesla’s show relatively little battery degradation even after high usage.
 -
5.
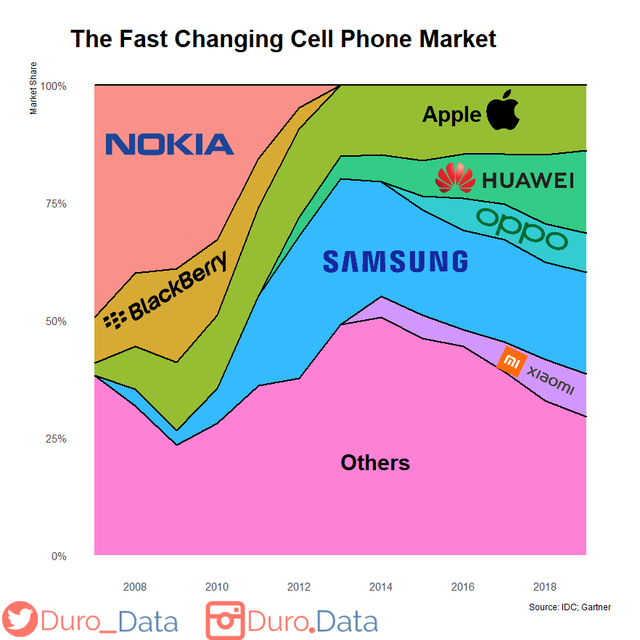 In 2007, the smartphone market was dominated by Nokia and Blackberry
 -
6.
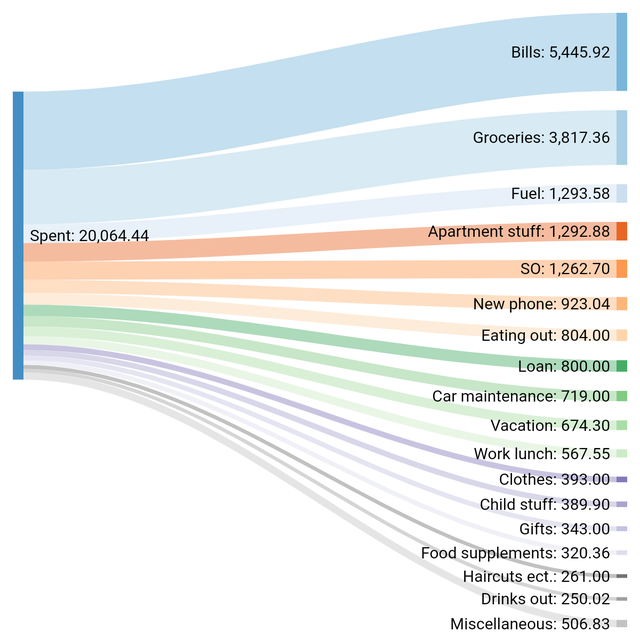 I tracked every € I spent in 2020.
 -
7.
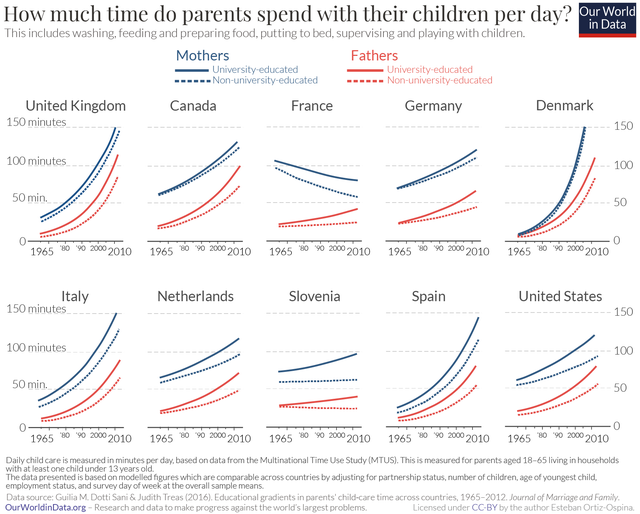 Time that fathers and mothers spend with their children (1965-2010)
 -
8.
 Commuter Regions of the United States
 -
9.
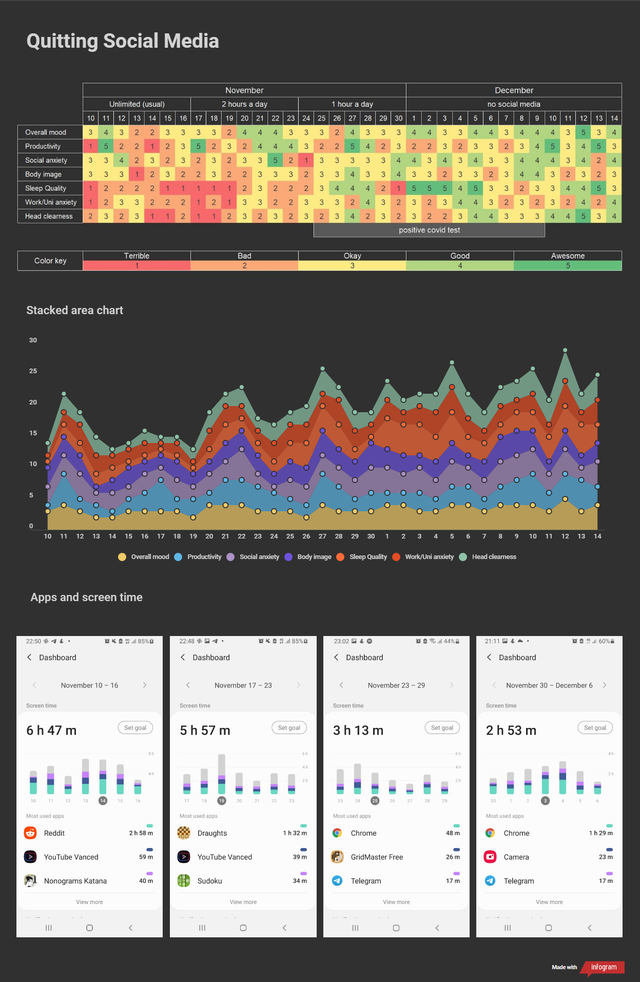 Quitting Social Media as a 22-year-old
 -
10.
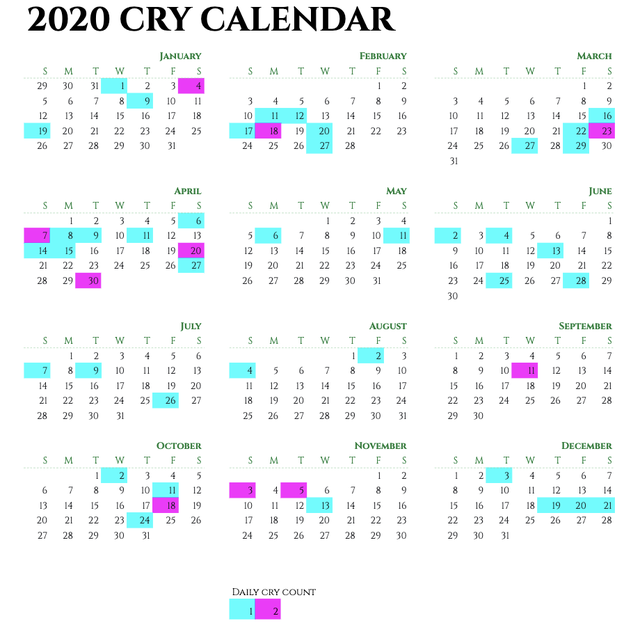 I tracked how many times I cried in 2020.
 -
11.
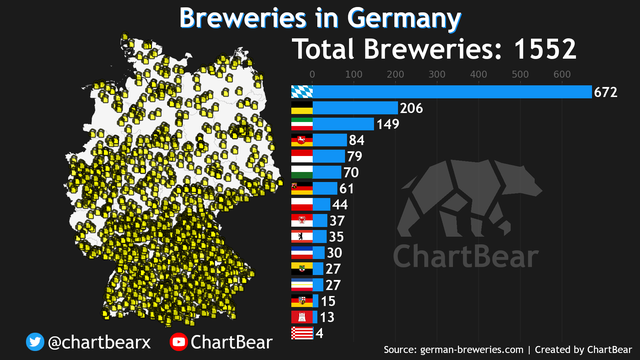 Beer Breweries in Germany
 -
12.
 The most dangerous jobs in America
 -
13.
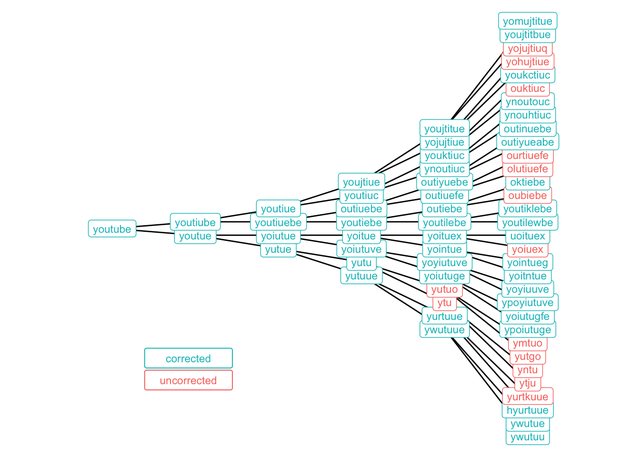 Some of the ways you can misspell “YouTube” and still have Google Search auto-correct you.
 -
14.
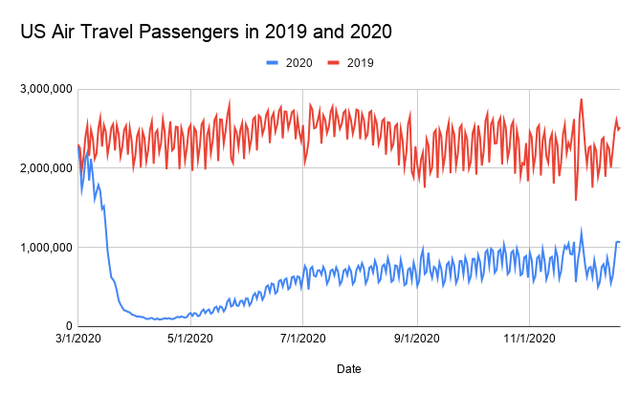 US Air Travel Passengers in 2019 and 2020
 -
15.
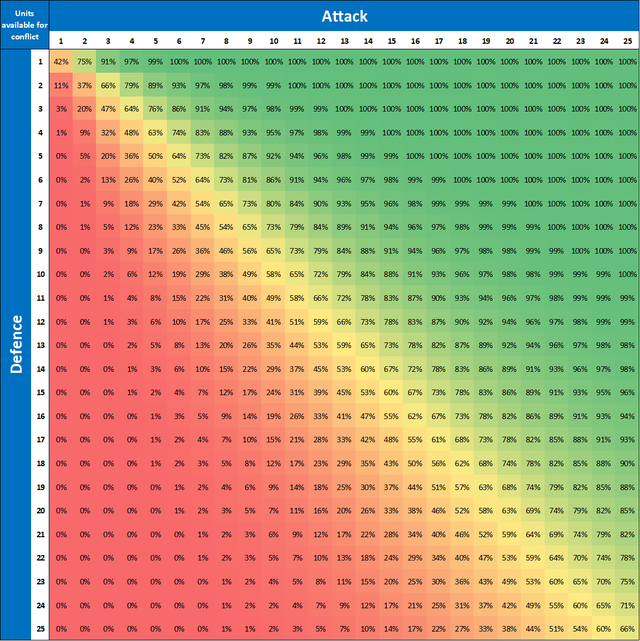 Probabilities of winning an attack in Risk
 -
16.
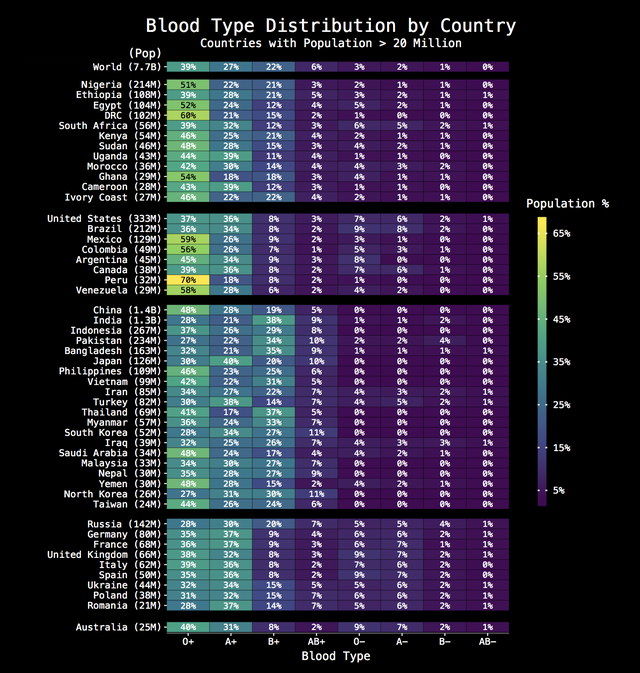 Blood Type Distribution by Country
 -
17.
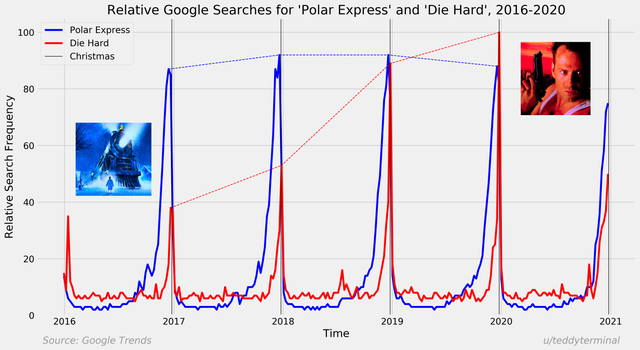 The True Christmas Movie: Comparison of Google Search Trends from 2016-2020 for “Die Hard” and “Polar Express”
 -
18.
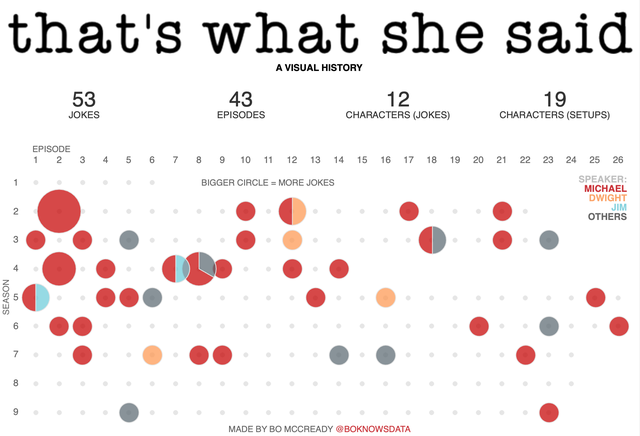 That’s What She Said: A Visual History (The Office)
 -
19.
 Legality of Owning a Monkey in the U.S. and Canada
 -
20.
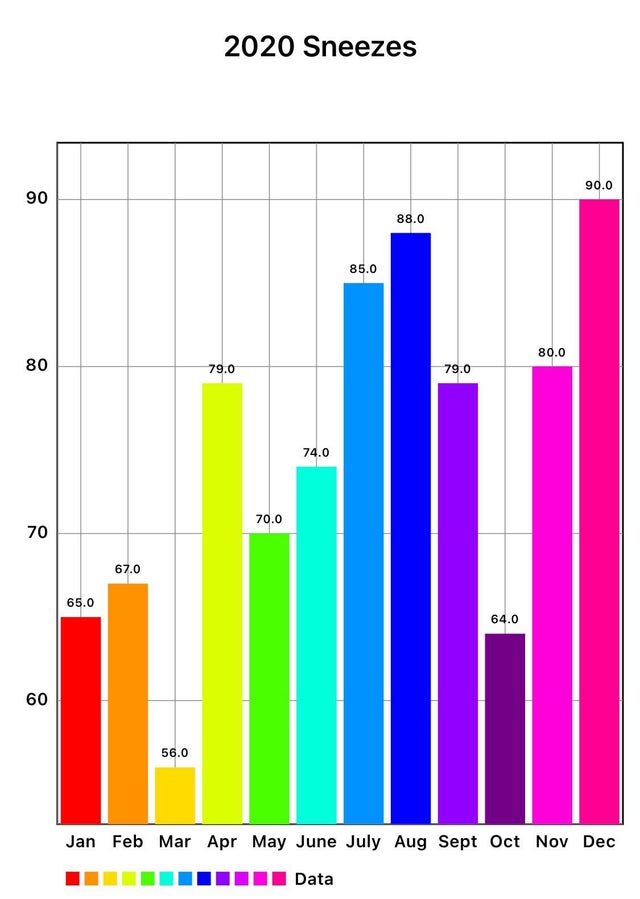 Every year, I decide to document something trivial. For 2020, I recorded every single time I sneezed. The total number came out to be 897 sneezes!
 -
21.
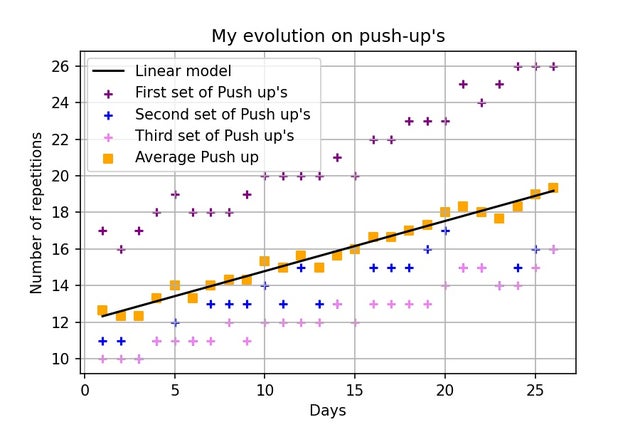 My evolution of 3 months doing push-ups regularly.
- NEXT GALLERY
-

- The Cutest Eye Bleach To Cleanse Your Weary Eyes
Harry Potter Characters: Screen time vs. Mentions In The Books
21/21
1/21
Categories:
Wow





0 Comments