23 Infographs With Fascinating Data.
Nathan Johnson
Published
07/08/2021
in
wow
There is a chart for almost anything.
- List View
- Player View
- Grid View
Advertisement
-
1.
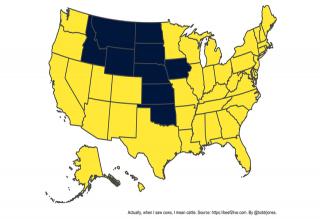
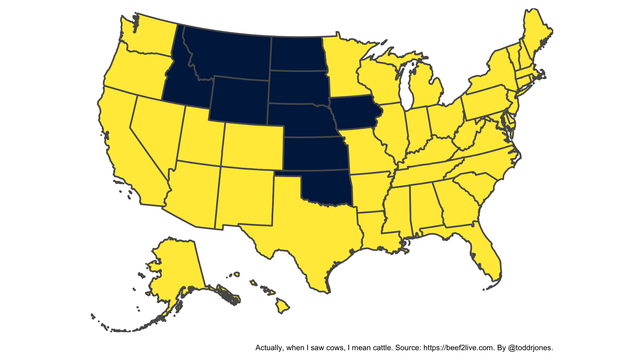 There are more cows than people in the states colored blue.
 -
2.
-
3.
-
4.
-
5.
-
6.
-
7.
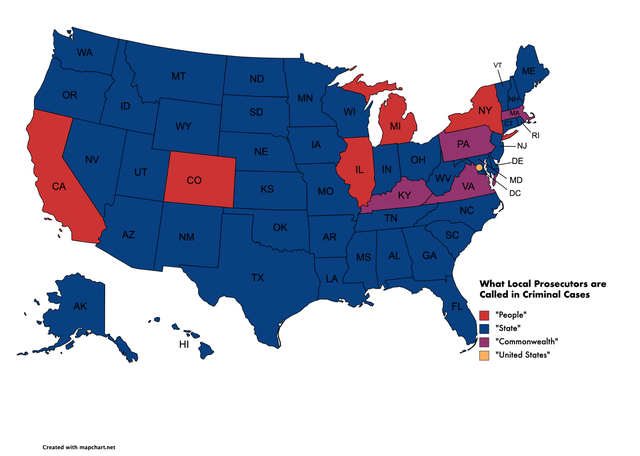 What the Prosecution is Called in the Different States
 -
8.
-
9.
-
10.
-
11.
 Super Mario Bros. Speedrun World Record Progression (2010-2021)
 -
12.
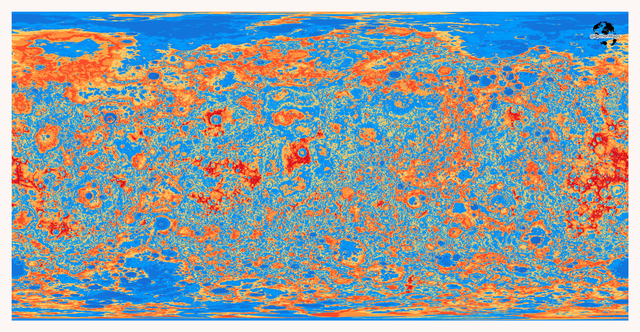 What would a wet Mercury look like? This is a topographical map that shows Mercury with an ocean covering ~70% of the surface.
 -
13.
-
14.
-
15.
-
16.
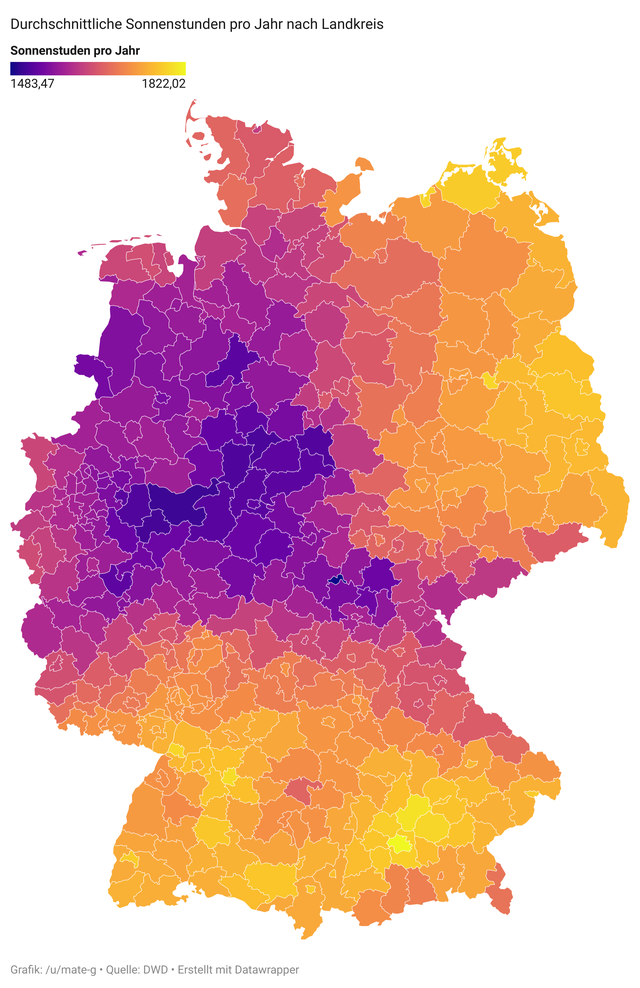 Average yearly sunshine hours of Germany.
 -
17.
-
18.
-
19.
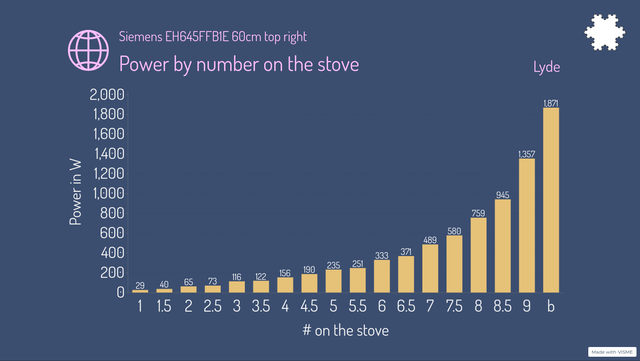 The power of my stovetop rises almost exponentially.
 -
20.
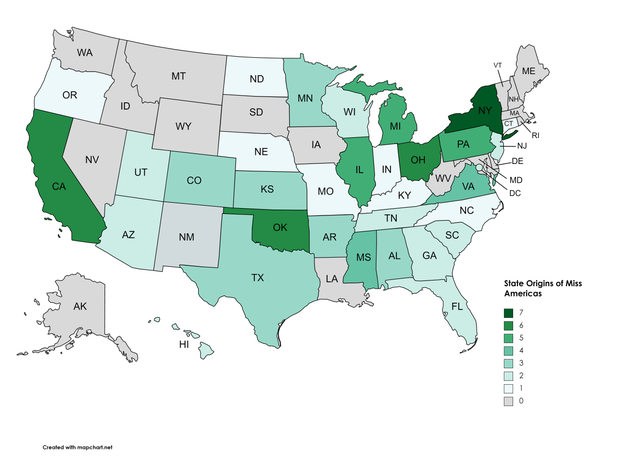 Number of Miss Americas by U.S. State
 -
21.
-
22.
-
23.
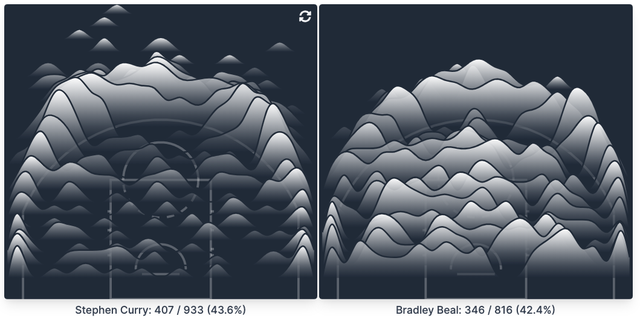 Every jump shot from the two leading scorers in the NBA this year, visualized.
- REPLAY GALLERY
-
- 23 Infographs With Fascinating Data.
- NEXT GALLERY
-

- 34 Interesting Things Found At The Beach.
There are more cows than people in the states colored blue.
23/23
1/23
Categories:
Wow




0 Comments